
After fixing the timing problem with the sensor library, I started the data logger and recorded data in 10 seconds intervals until the memory was full. This time the AM2302 (DHT22) sensor was read every time, no cached values were used.
It created a really interesting data set you can see in the diagram below (click on the diagram to see all details):

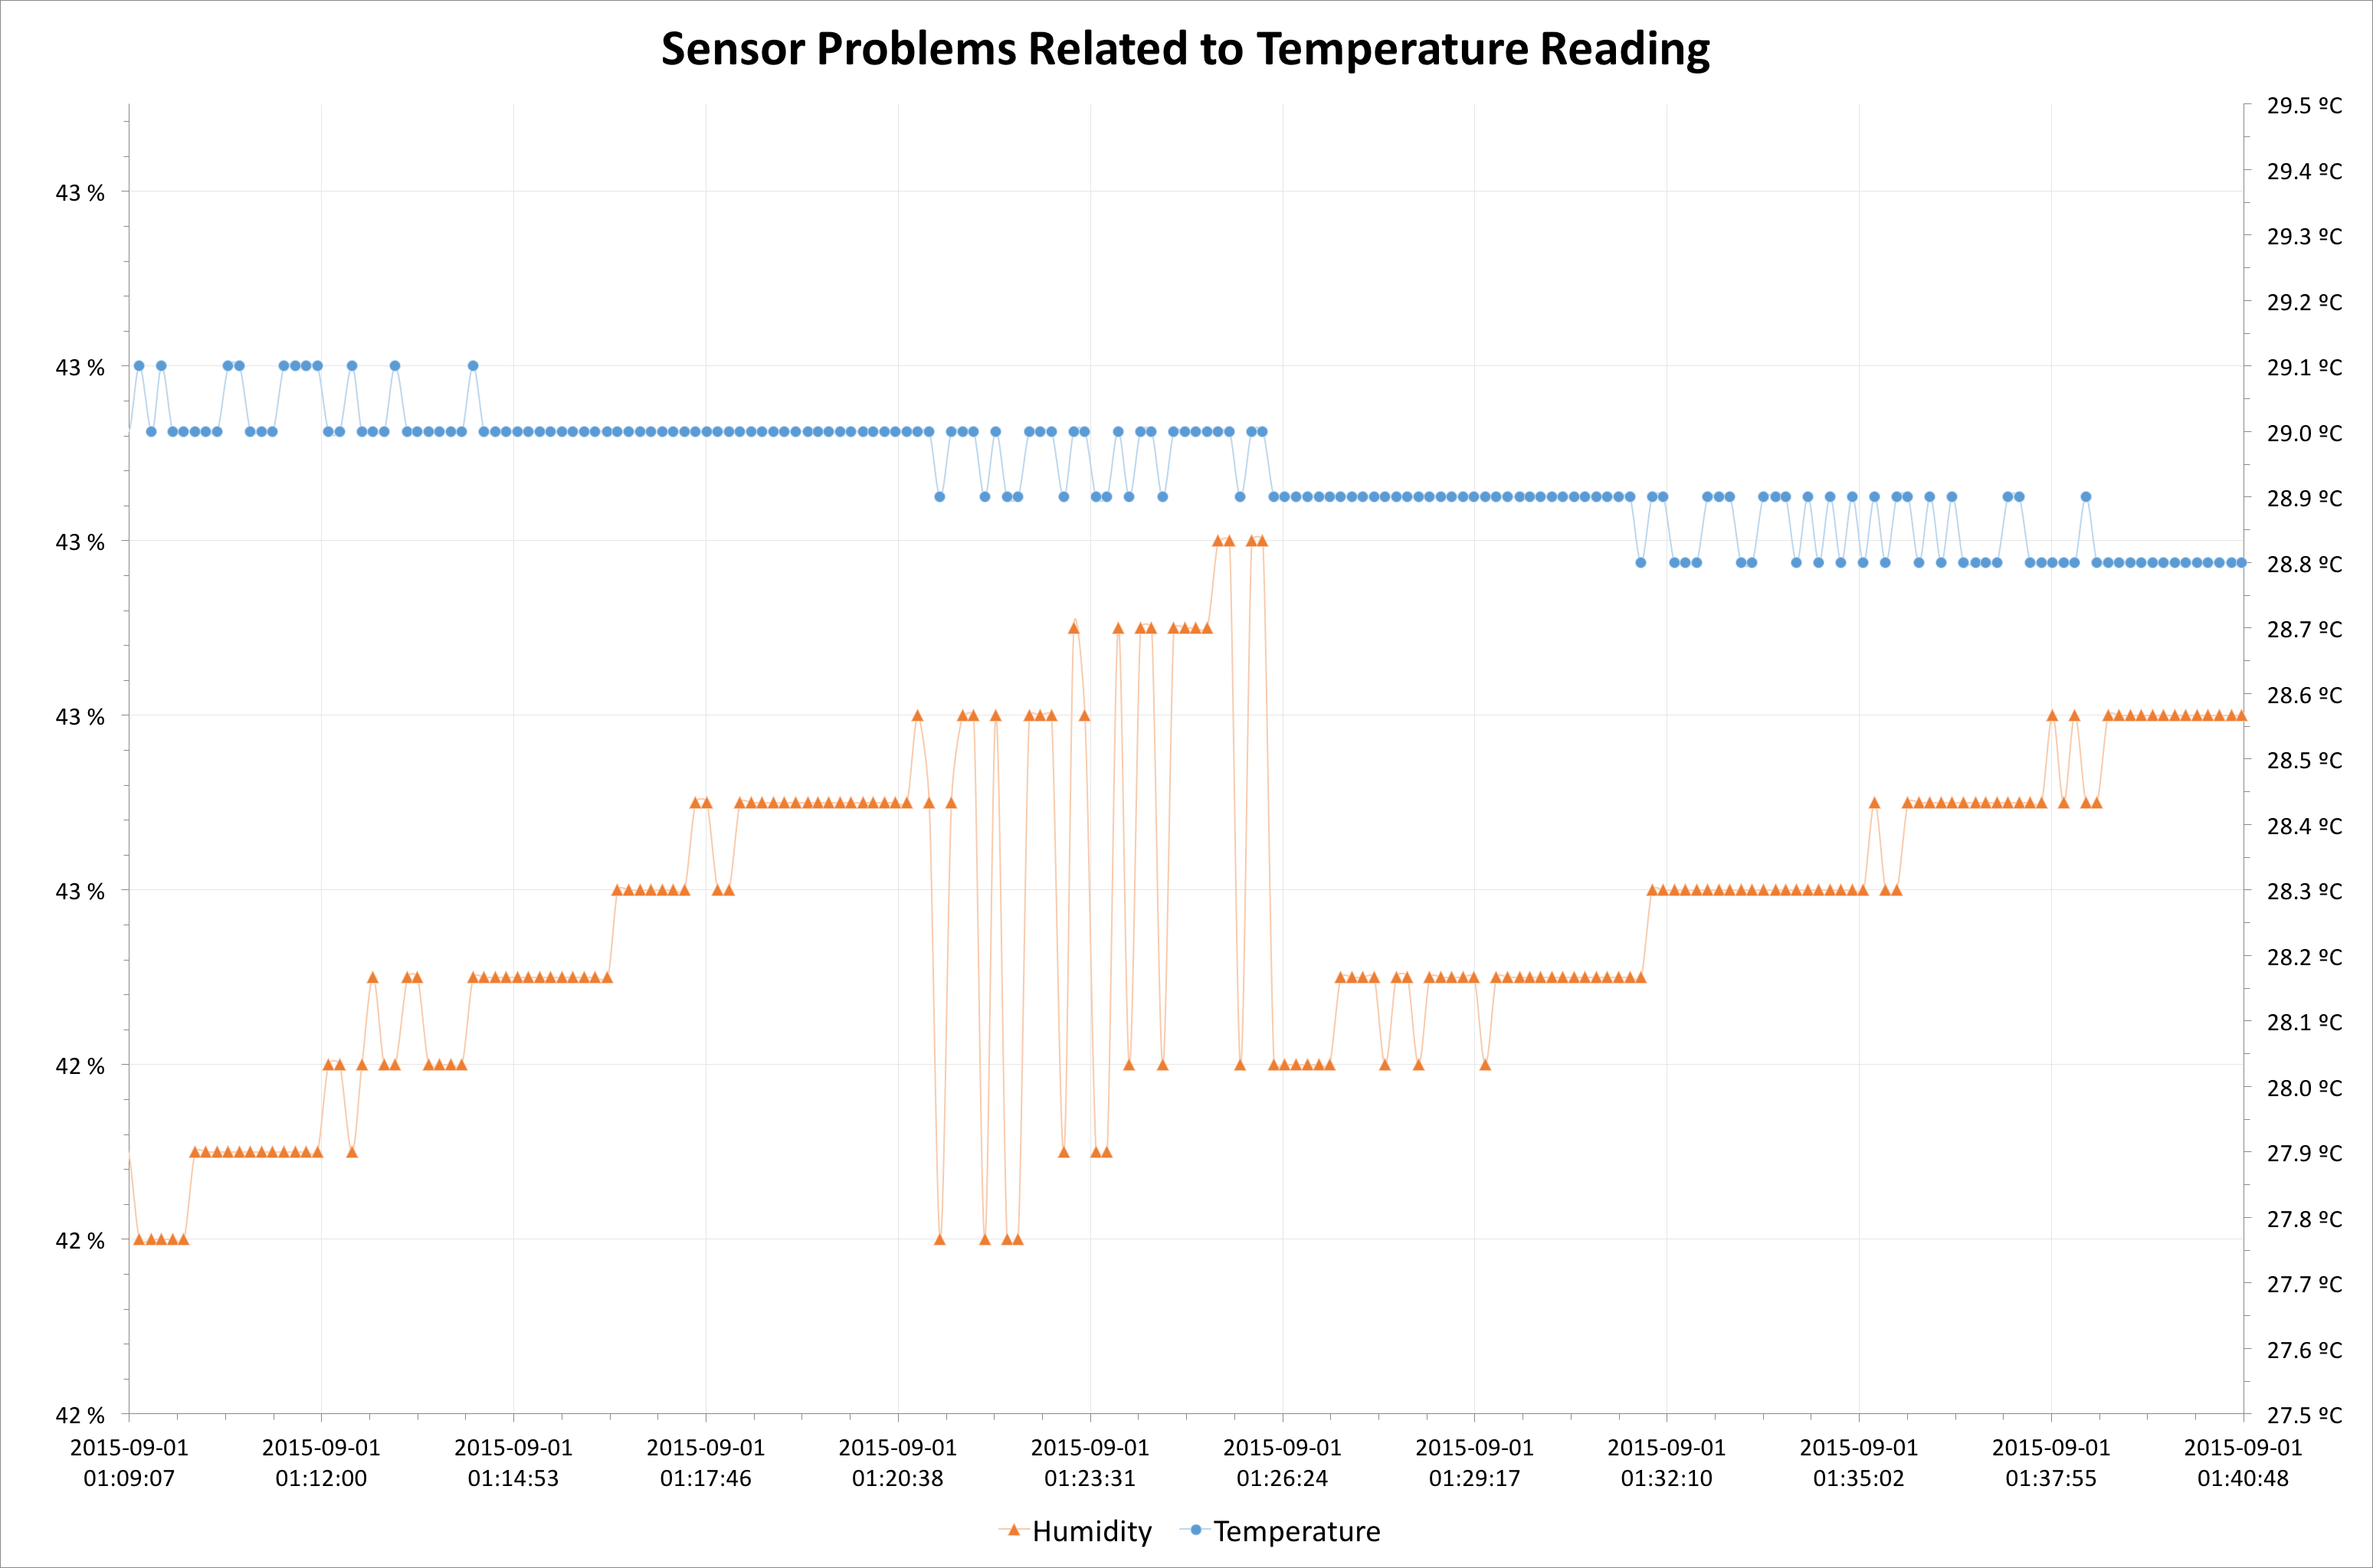
The actual measured data values are the small dots in the background, and the lines are polynomial interpolated over these values.
For the temperature (blue) you can see the sensor precision limit of 0.1 and an interesting jitter when the value makes the transition from one value to another. In contrast, the humidity values (orange) do not have the same jitter like the temperature values, but you can see something strange at the crossing point of the two series.
In Detail
I created a new diagram where you can see this point in detail:
The jitter of the humidity values is minimal, but suddenly there are huge jumps of the values. Compare the jumps with the corresponding temperature values. Because the humidity value depends on the temperature, the jitter from the temperature causes the humidity values to jump.
Conclusions
The test was successful: There is now real sensor data for each measurement.
If this sensor is used for a real time display of humidity and temperature values, there has to be some integrated interpolation to flatten the jitter of the read values. This is no big deal for the data logger, because you can easily do all the corrections and interpolations afterwards.
Related Files
You can download the CSV file with the measurements and the Excel sheet I used with the links below: